One plant, two tariffs: what changes when you can see inside the panel
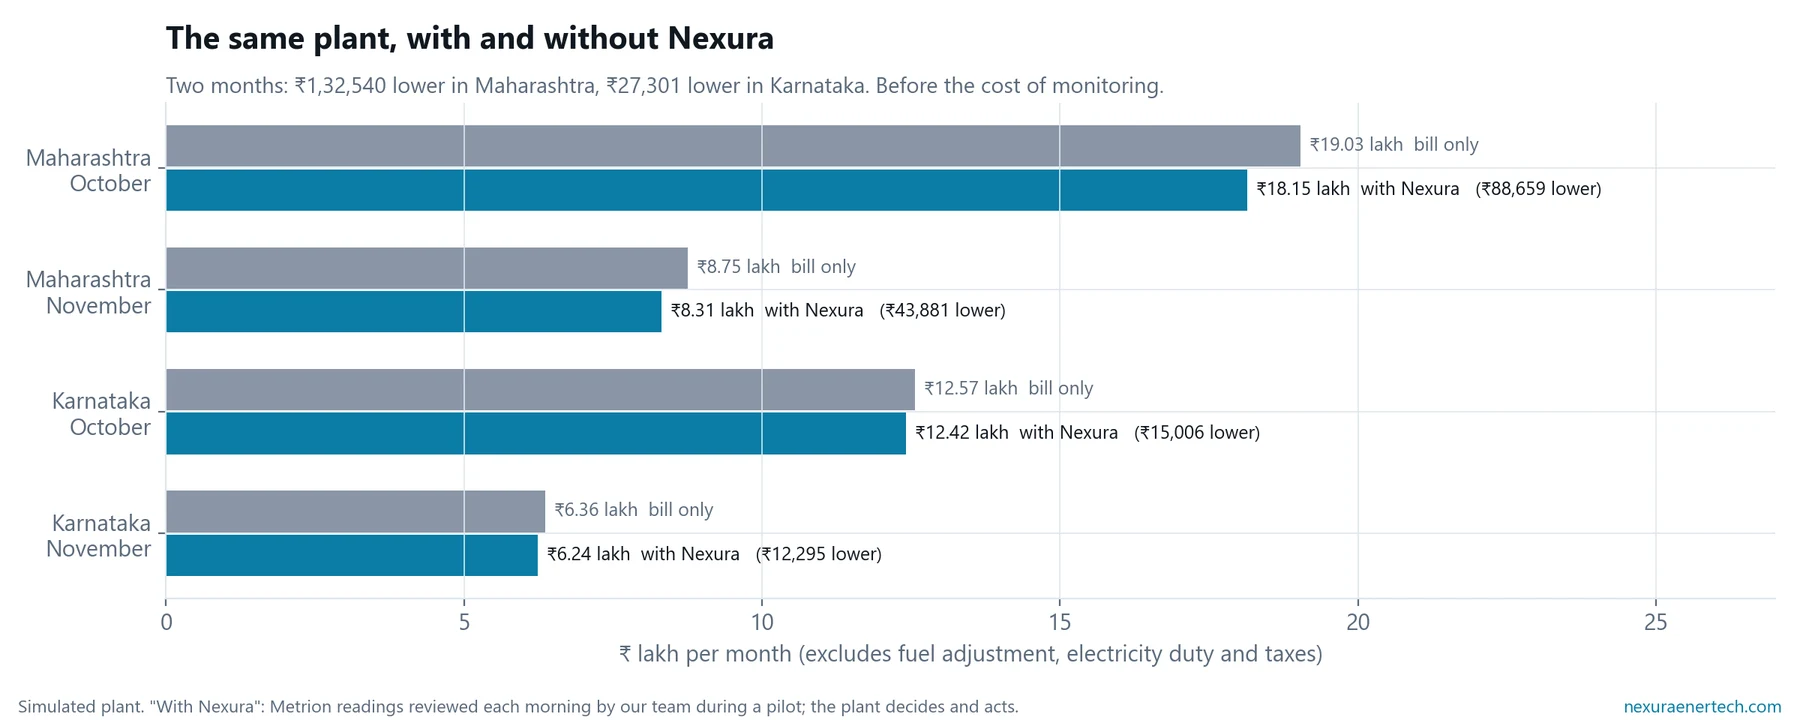
We simulated a mid-size auto-component plant minute by minute for two months and priced it under the Maharashtra and Karnataka industrial tariffs for 2026-27, once with only the monthly bill to go on and once with every feeder measured and reviewed each morning. Finding three ordinary problems the next day instead of from the bill made the two-month bill ₹1,32,540 lower in Maharashtra and ₹27,301 lower in Karnataka.
Full write-up: download the PDF, with every source and figure.
What is the plant?
A fictional auto-component plant in a Pune-area industrial estate on one HT connection with a contract demand of 540 kVA: four hydraulic presses, a servo press, a CNC bay, an air compressor, a chiller, a 110 kW tempering oven, and lighting and offices. It runs two shifts in October and one in November, when orders slow. Every feeder is modelled minute by minute for 61 days.
Three ordinary things go wrong:
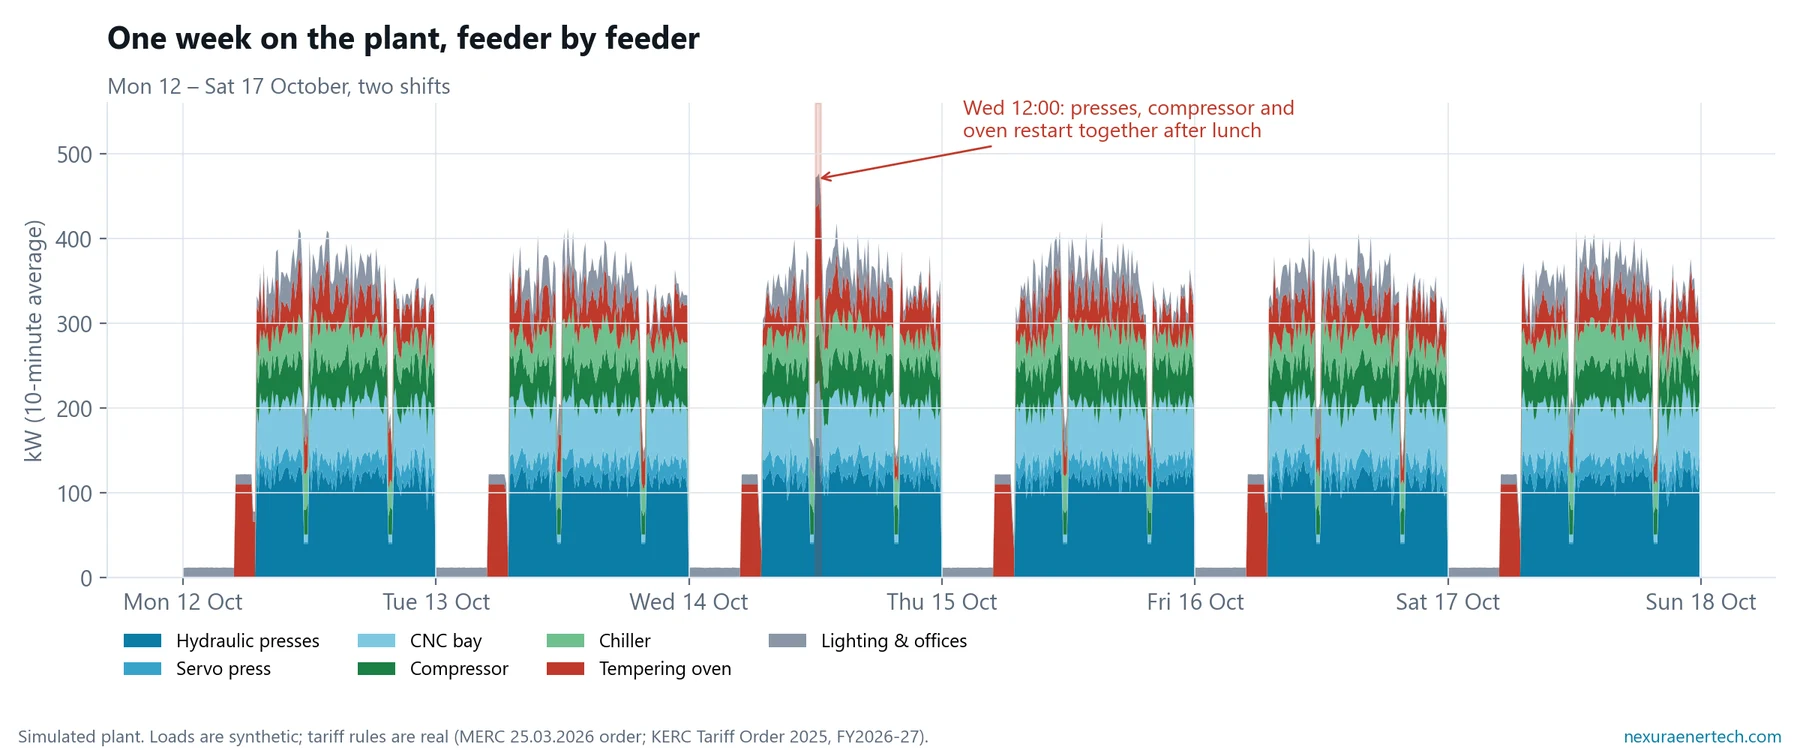
- 14 October: to save power, the oven is switched off over lunch. At 12:00 it re-heats at full power just as the presses restart and the compressor refills.
- 15 October: the fuse feeding five of the six capacitor steps blows. Nobody notices.
- 16–21 November: a slow week; presses and the compressor are left running unloaded.
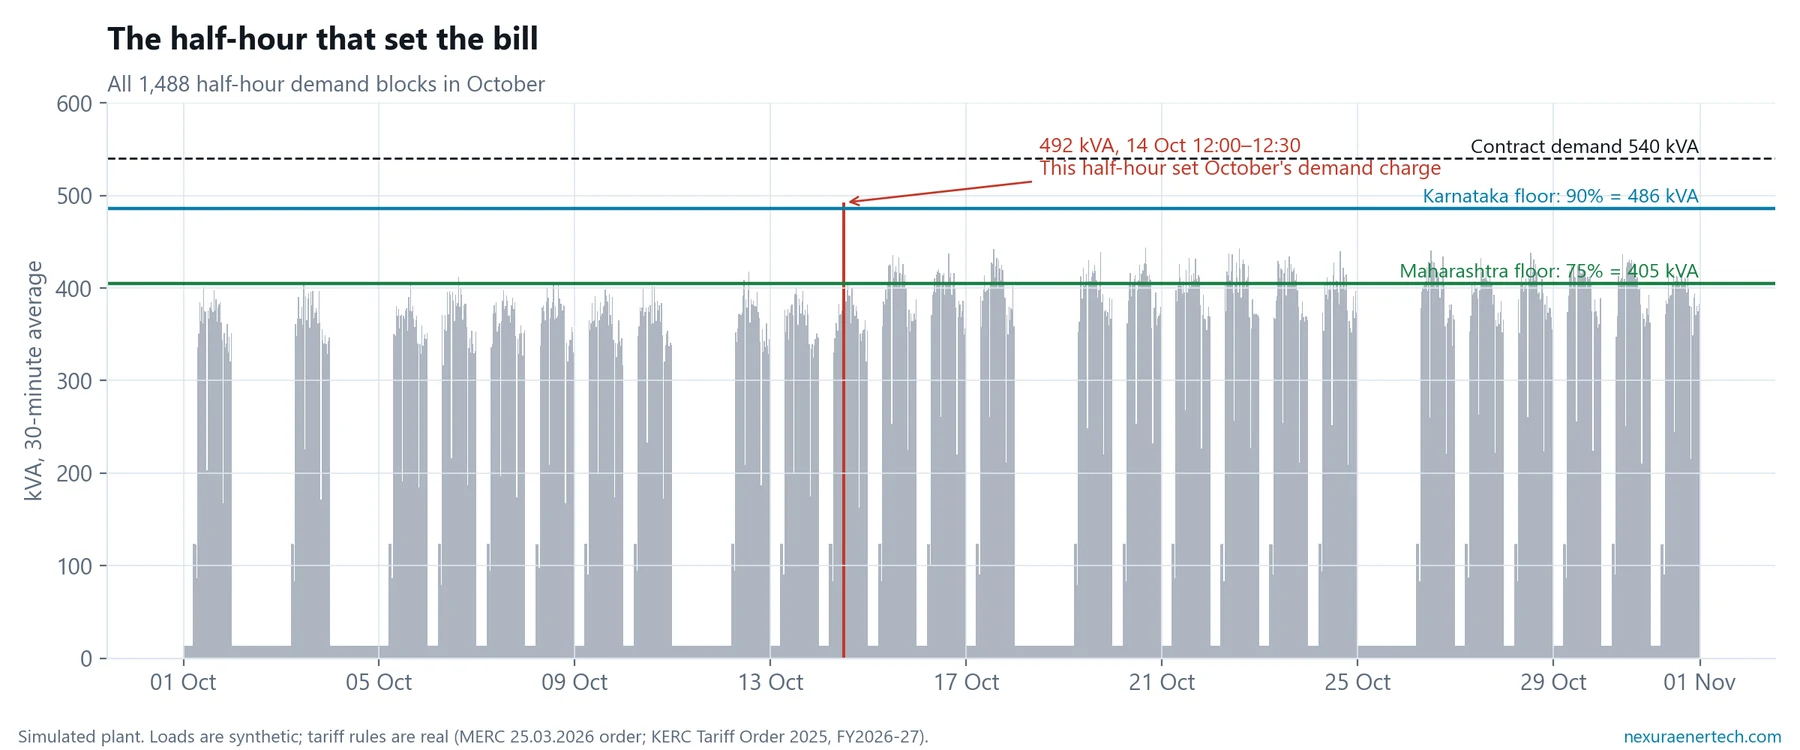
Which half-hour set the demand charge?
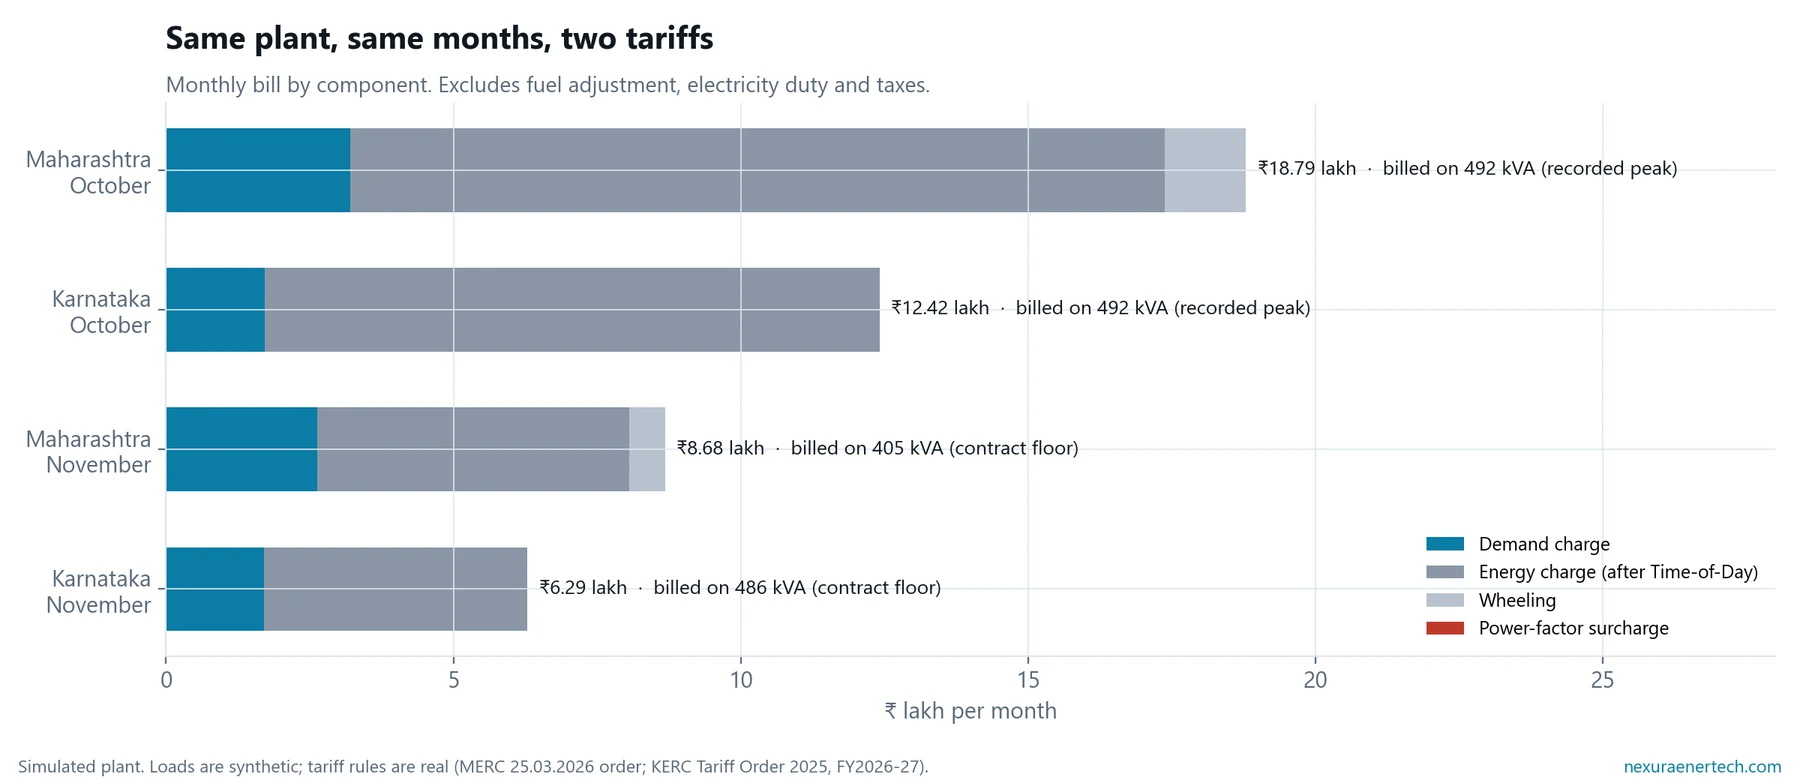
Both states bill industry on maximum demand: the highest average kVA in any 30-minute block of the month. On a normal day this plant peaks around 400–440 kVA. The lunchtime restart produced one half-hour at 492 kVA, about 50 kVA above any other block in October, and the whole month’s demand charge is billed on it.
Each state puts a floor under billing demand. Maharashtra bills the higher of recorded maximum demand or 75% of contract demand (405 kVA here). Karnataka bills the higher of maximum demand or 90% (486 kVA).
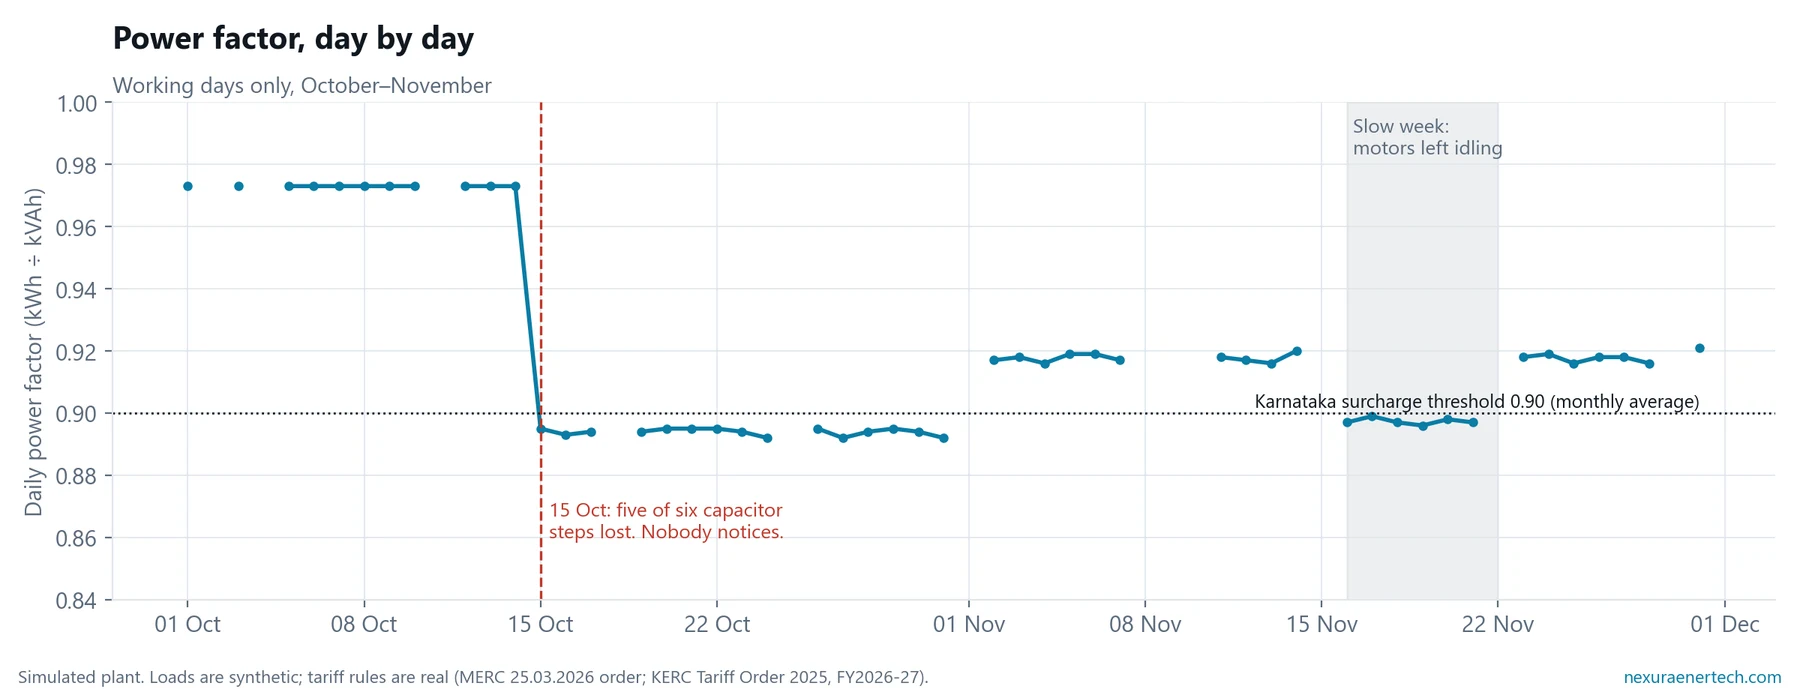
What did the failed capacitor cost?
Power factor drops from about 0.97 to 0.89 on 15 October and stays there. Maharashtra bills HT industry in kVAh, so the lower power factor raises the billed units every day. Karnataka bills in kWh and adds a surcharge only when the monthly average falls below 0.90. Here it stayed at 0.93 in October and 0.91 in November, so the Karnataka bill showed nothing.
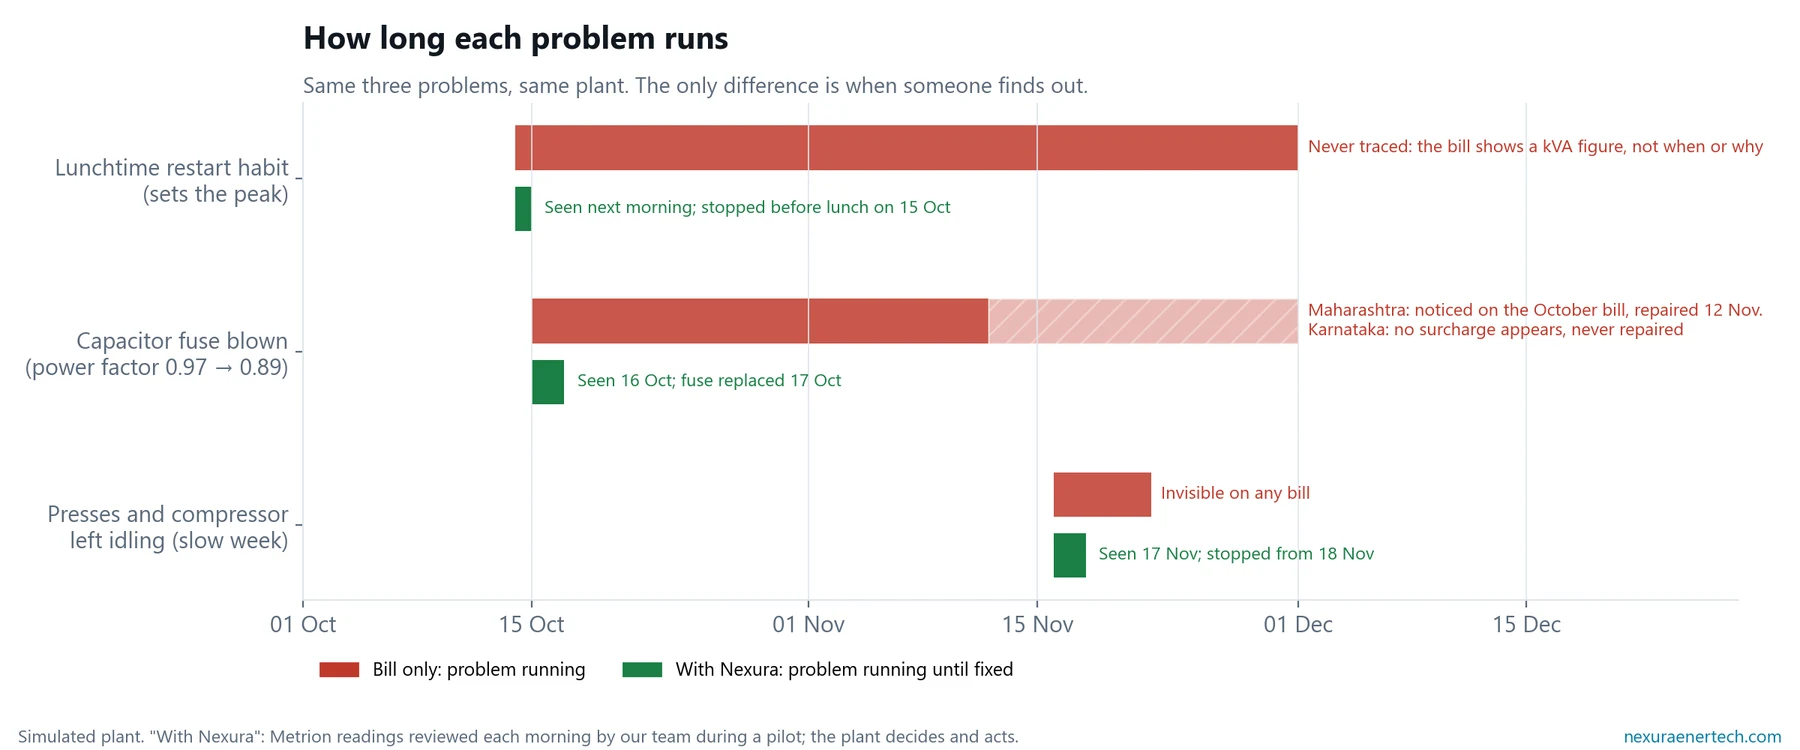
Where does Nexura come in?
We ran the same two months again in two worlds.
- Bill only. The lunchtime habit carries on, because the bill shows a kVA figure but not when or why. In Maharashtra the October bill prints a lower power factor and the capacitors are repaired on 12 November. In Karnataka no surcharge appears, so nothing prompts a repair.
- With Nexura. Metrion measures every feeder inside the panel and Kairon prices the readings against the plant’s own tariff. Every morning our team reviews that analysis and emails the plant a short review of what it shows. The plant decides what to do; Kairon recommends and never switches anything.
| What happened | Seen with Nexura | Maharashtra | Karnataka |
|---|---|---|---|
| Lunchtime restart sets a new peak | Next morning; restarts staggered from 15 Oct | ₹53,392 | ₹22,181 |
| Capacitor fuse blows | 16 Oct; fuse replaced 17 Oct | ₹81,028 | ≈ ₹0 |
| Machines left idling | 17 Nov; stopped when idle from 18 Nov | ₹5,681 | ₹4,847 |
| Two months together | The individual values overlap | ₹1,32,540 | ₹27,301 |
What other changes were tested?
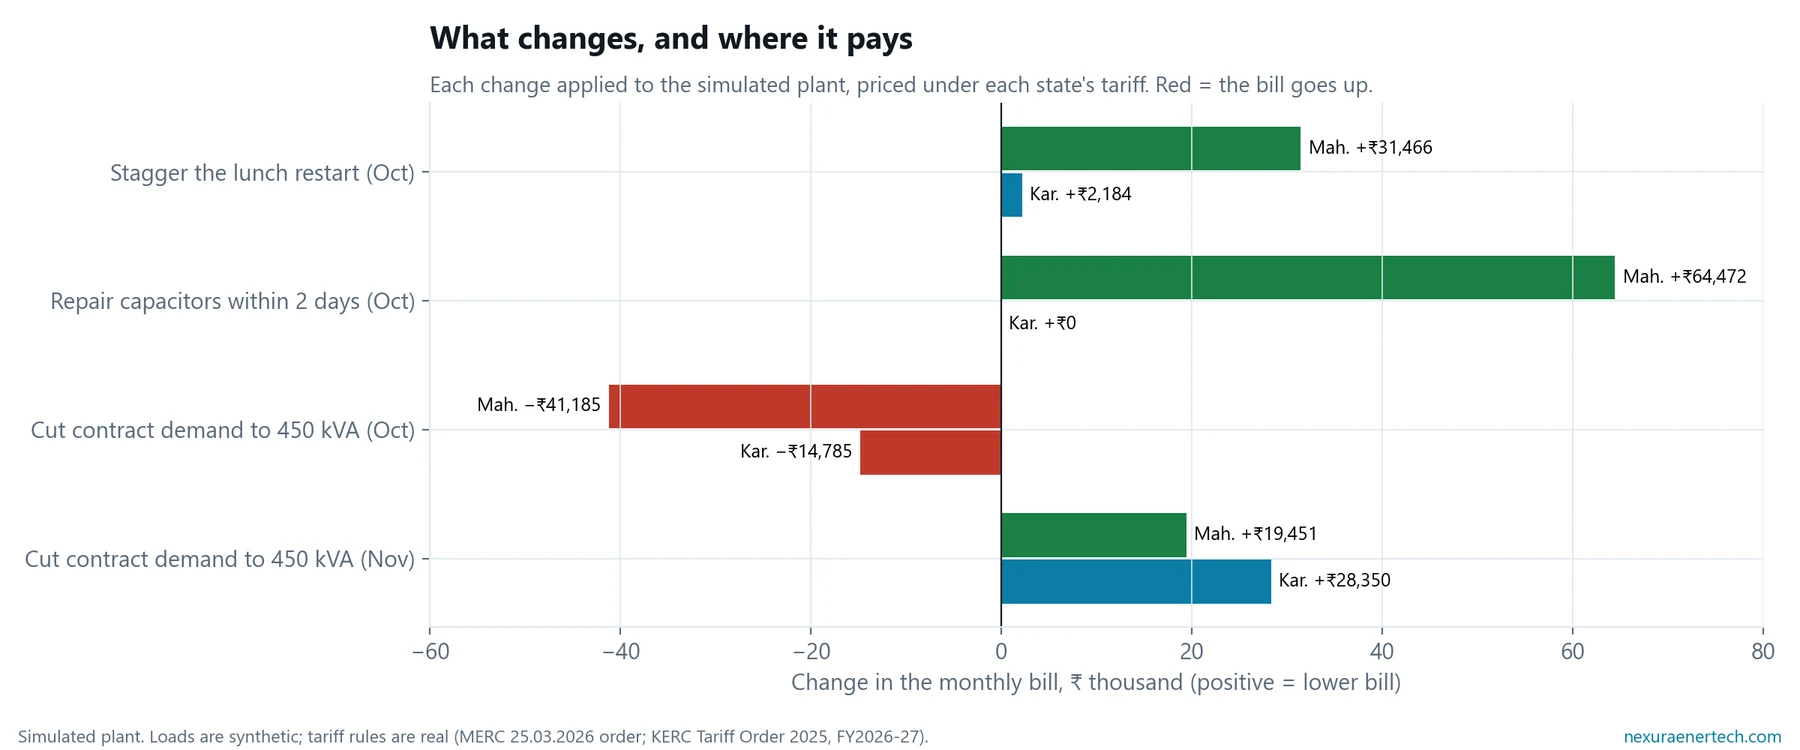
Staggering the restart alone is worth ₹31,466 in October in Maharashtra and ₹2,184 in Karnataka, where the 90% floor absorbs most of the reduction. Cutting contract demand to 450 kVA after the quiet November looks tempting, but October’s 492 kVA would then exceed it and draw excess-demand penalties of ₹41,185 in Maharashtra and ₹14,785 in Karnataka. A contract-demand change is only safe once you know what sets your peak.
The bill, line by line
How was it computed, and what does it not show?
- Each feeder’s active and reactive power is generated minute by minute; a capacitor panel switches steps against the total; 30-minute demand blocks are averaged from the one-minute kVA.
- Pricing is a pure function of the readings and each state’s tariff held as data. The two worlds use identical random draws, so every rupee of difference comes from when a problem was found and fixed.
- It does not show meter accuracy, a real plant, a promised saving, or the full bill.
Sources
- Maharashtra: MERC Order, Case No. 75 of 2025 (post-remand), 25 March 2026 — HT I(A) rates p.100, Time-of-Day Table 8 pp.76–77; MERC Case No. 217 of 2024 — billing demand p.787, excess demand p.785, kVAh billing para 7.16.7.
- Karnataka: KERC Combined ESCOMs Tariff Order 2025 (27 March 2025), Annexure 9 — HT-2(a) rates p.550, billing demand and excess demand cl.1, power factor cl.2, p.545, Time-of-Day p.552; 30-minute maximum demand, Conditions of Supply cl.2.38.
Related: kVAh vs kWh billing explained.
Want to see this on your own panel?
Start with a free Bill X-ray: send your last three electricity bills and we return a written reading within two working days, with no obligation. If it shows something worth measuring, a 30-day paid pilot gives you a daily written review and a report reconciled to your next bill, and the fee counts towards your plan.
Get a free Bill X-ray